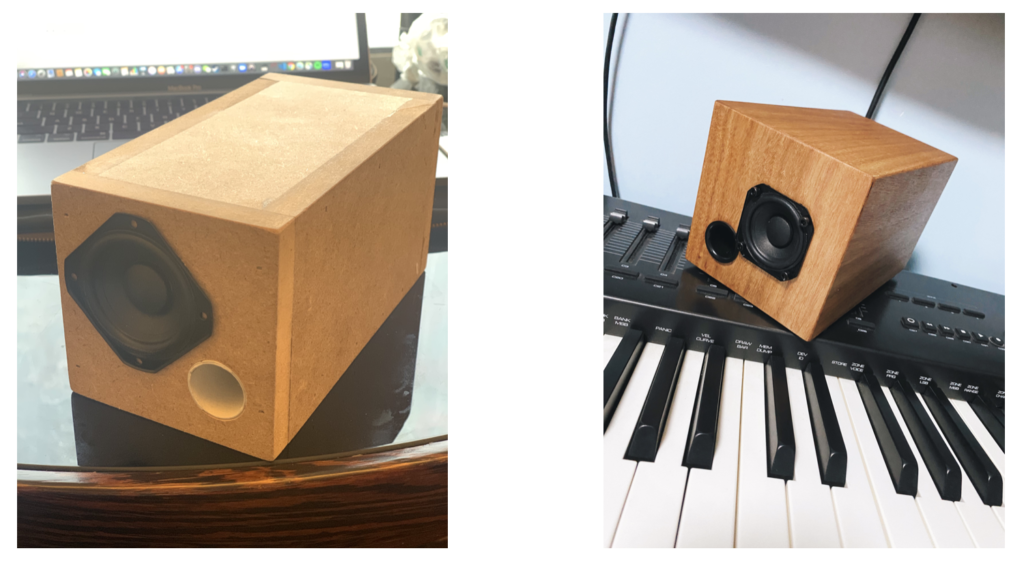
The picture on the left is the enclosure built by Jun, while the one on the right is built by Changjie.
1. Preparation
Proposal
- (23rd, Oct) Decide the brand and size of amplifier that we want to build and enclosure for and finalize the types of enclosures
- (31st, Oct) Research on acoustic characteristics different materials have and come up with a general diagram of the enclosure, including amplifier placement.
- (7th, Nov) Finalize the dimension of the enclosure and elements inside so that a relatively equal dispersion at all frequency can be achieved.
- (23rd, Nov) Test the quality of the enclosure and prepare for the presentation.
Choosing the Driver
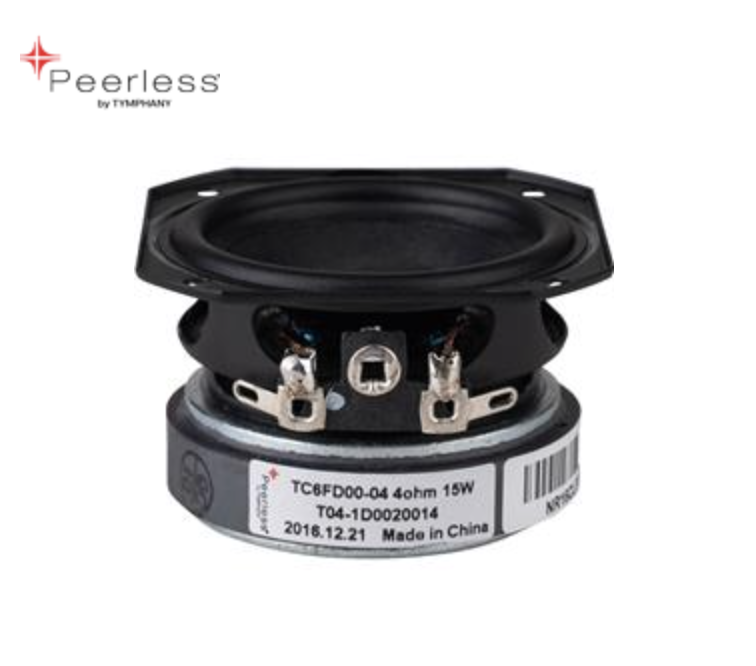
Why this driver?
We choose this driver because it is accessible both in China and the United States. Also, we want to start easy and go for a driver that’s cheap and relatively small in size.
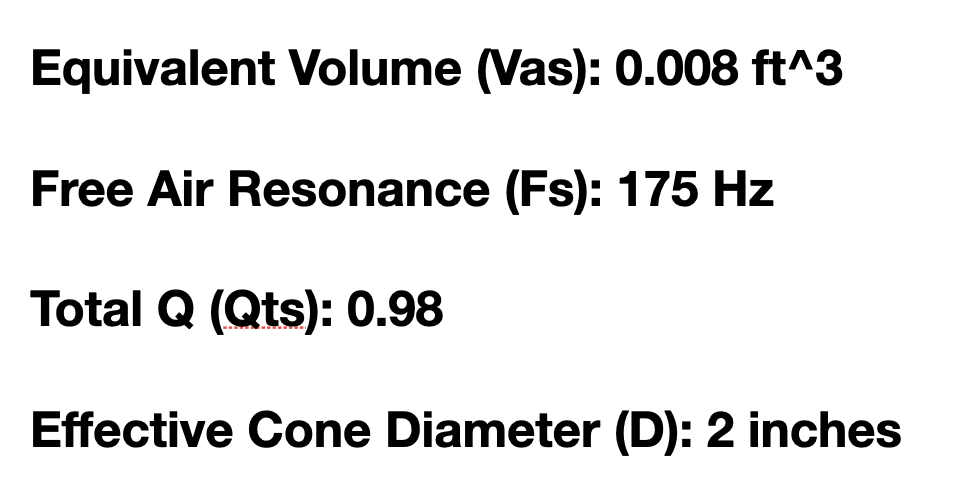
Meaning of the terms
- Equivalent Volume: Equivalent volume of air that has a compliance equal to that of the driver’s moving system.
- Free Air resonance: The Loudspeaker’s resonant frequency in free air.
- Total Q: A number calculated from Qes and Qms that indicates what type of enclosure is suited for the driver. Normally, Qts of 0.4 or below would use a vented enclosure, while a Qts of 0.7 or above suits well with a sealed box design.
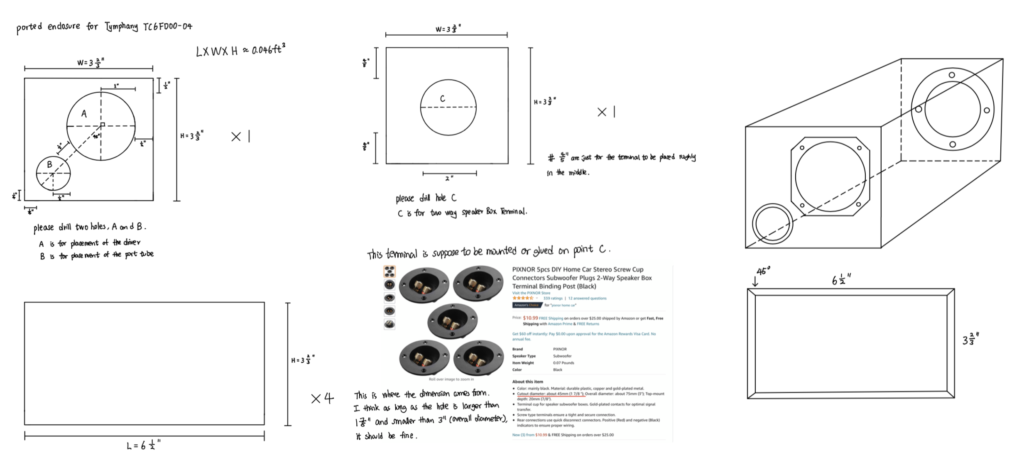
Design Diagram
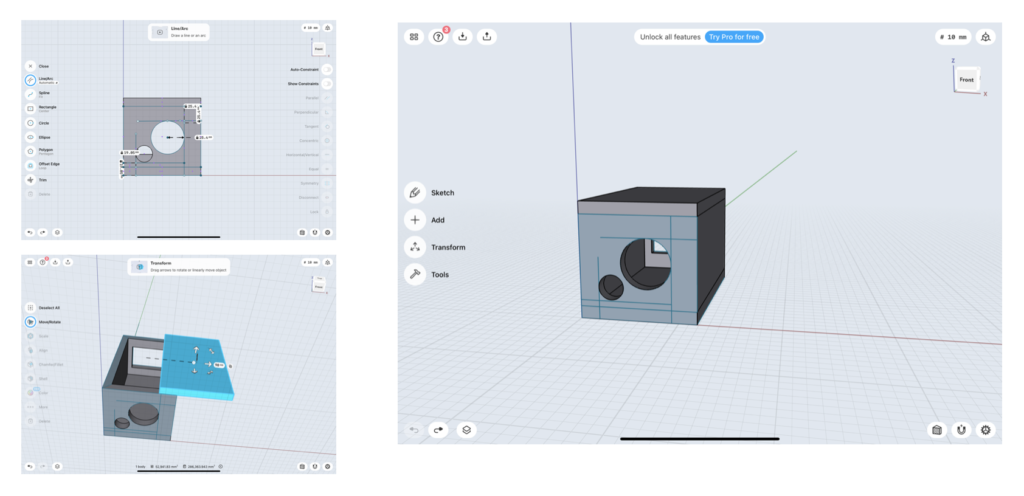
2. First Impulse Response Test
Using Matlab, we did an impulse response test in both home and lab set up to test the response of pure driver (without enclosure).
The parameters we use are 4 runs, 4 seconds per run, and excitation level -12dB.
Test Result
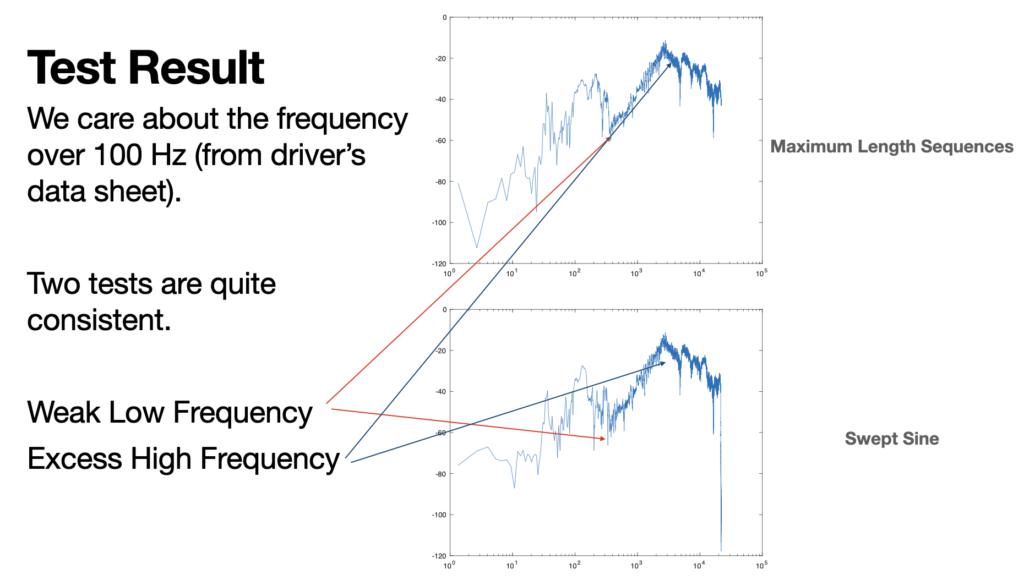
The result for both set ups are quite similar, We have a weak low frequency and an excess high frequency.
Comparison between our test result and the frequency response graph.
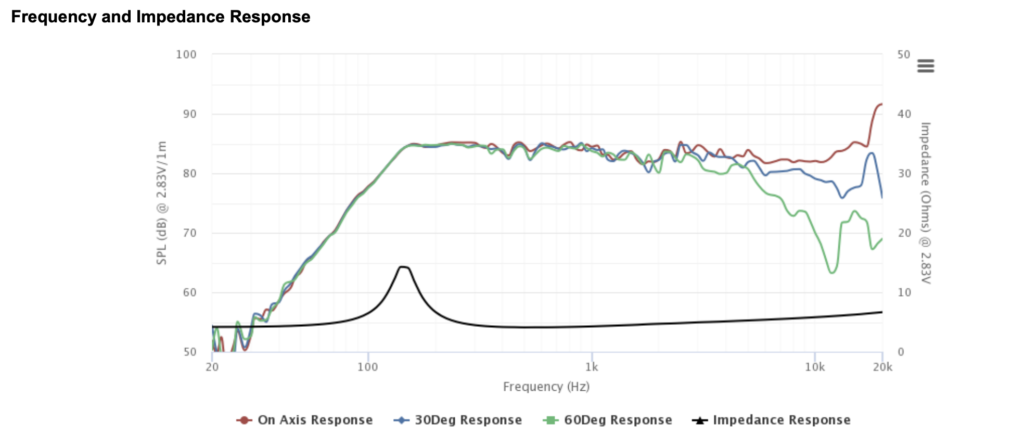
The result of two plots are quite different. The possible reasons might be the manufacture picking one of the best among all as the instruction, or the test is done in a questionable way.
Flatten out the frequency curve
- Boost the low frequency
- Cut the high frequency
We can boost the low the low frequency by adding a port tube
We can cut the high frequency by adding a piece of cotton to the inside.
3. Build the enclosure
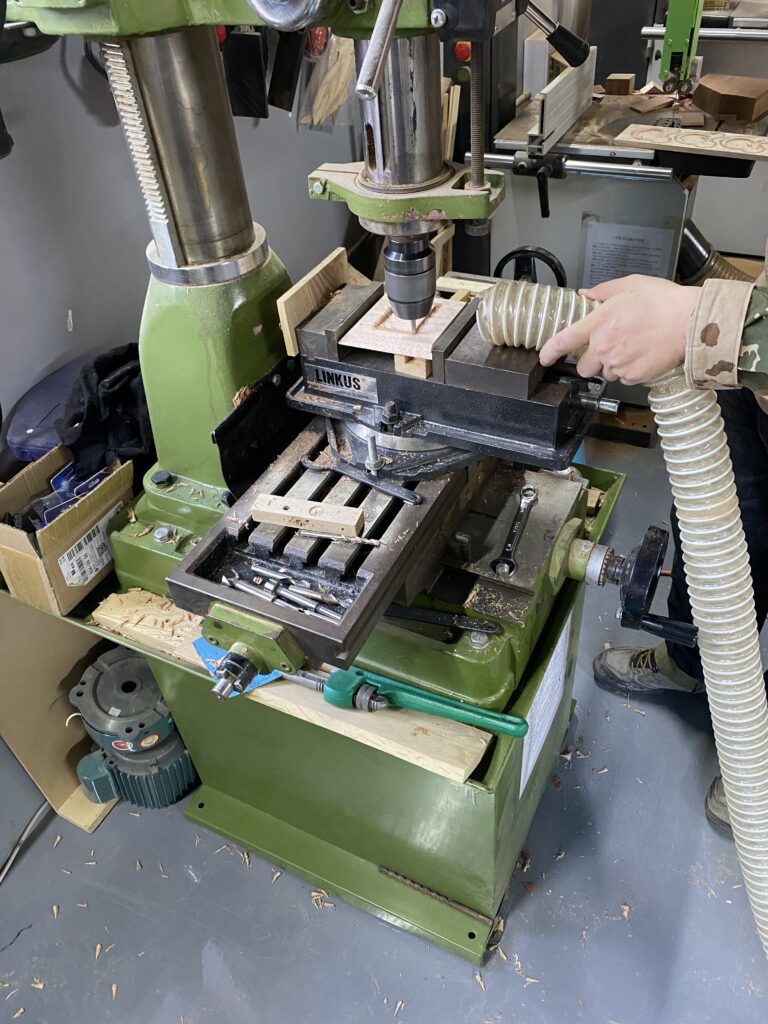
- Prepare all the materials: a piece of wood, a two-inch all-frequency driver, a one-inch diameter port tube, a terminal box, two pieces of audio cable, and sound insulation cotton.
- Cut the wood based on previous design. Engrave holes on the wood pieces. Stick the wood using white glue

3. Fill the wooden box with sound insulation cotton

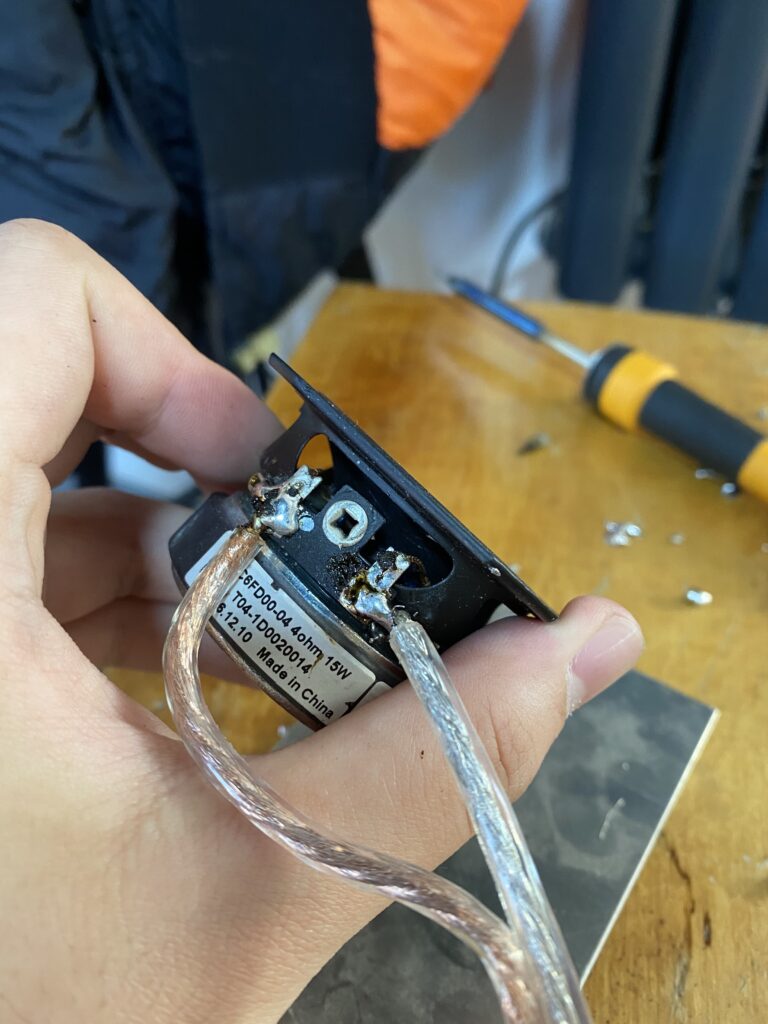
4. Solder the cable to the speaker and terminal box. Install the port tube.

5. Polish the enclosure using sand paper. Apply wax oil.

4. Second Impulse Response Test
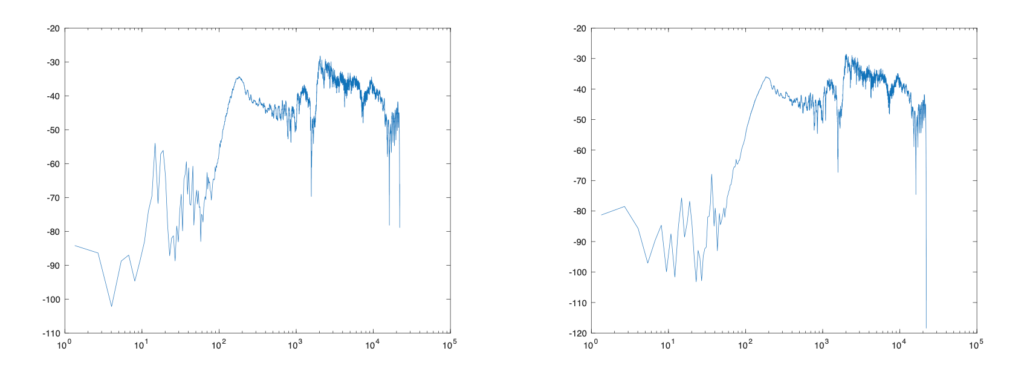
After we build our enclosures, we conduct the second impulse response test. These are the test results using Matlab apps Impulse Response Measurer. The parameters are 4 runs, 4 seconds per run, and excitation level -6dB.
Improvements
Same to the first impulse response test, we get two quite similar impulse response for MLS and Swept Sine. This time, we have a relatively flatter response for frequencies between 200 Hz to 20 kHz, which means our enclosures did a good job on cutting high frequencies and boosting low frequencies.
Shortcomings
However, we notice that there is an impulse response gap around 1600 to 1700 Hz. This is what we didn’t expect. This gap tells us the enclosure works poor when it deals with this frequency interval.
Possible Explanations for the Gap
1. The material of sound insulation cotton may introduce a frequency absorption around 1600 to 1700 Hz. Each materials have their characteristic frequency absorption coefficient. Though we don’t know what is the exact components of our sound insulation cotton, we find the absorption coefficient table for acoustic cotton. From the table, we can see that several products have maximum absorption at 2000 Hz. The coefficients explained our inference.

2. The sound waves from the port tube may interfere with those generated from the driver. Based on our design, the port tube and the driver are quite close to each other, which may cause destructive interferences around those specific frequencies.
3. The internal organization may introduce a frequency absorption around 1600 to 1700 Hz (e.g. the port tube in the body of the enclosure).
4. The screws on the driver may vibrate with it which introduce some interference with the output frequencies.
5. Test Results Comparison
With vs Without Enclosures
Blue – With Enclosures
Red – Without Enclosures
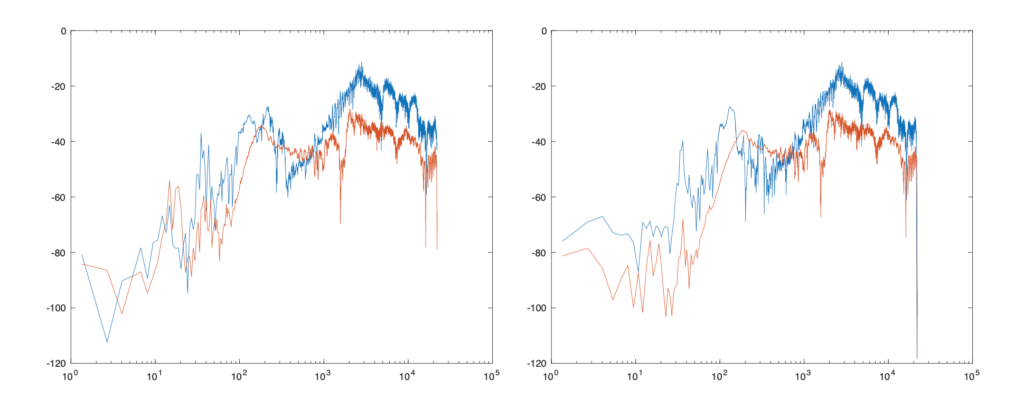
We can see that both MLS and Swept Sine show similar patterns over 200 Hz. Let’s take MLS as example to analyze.
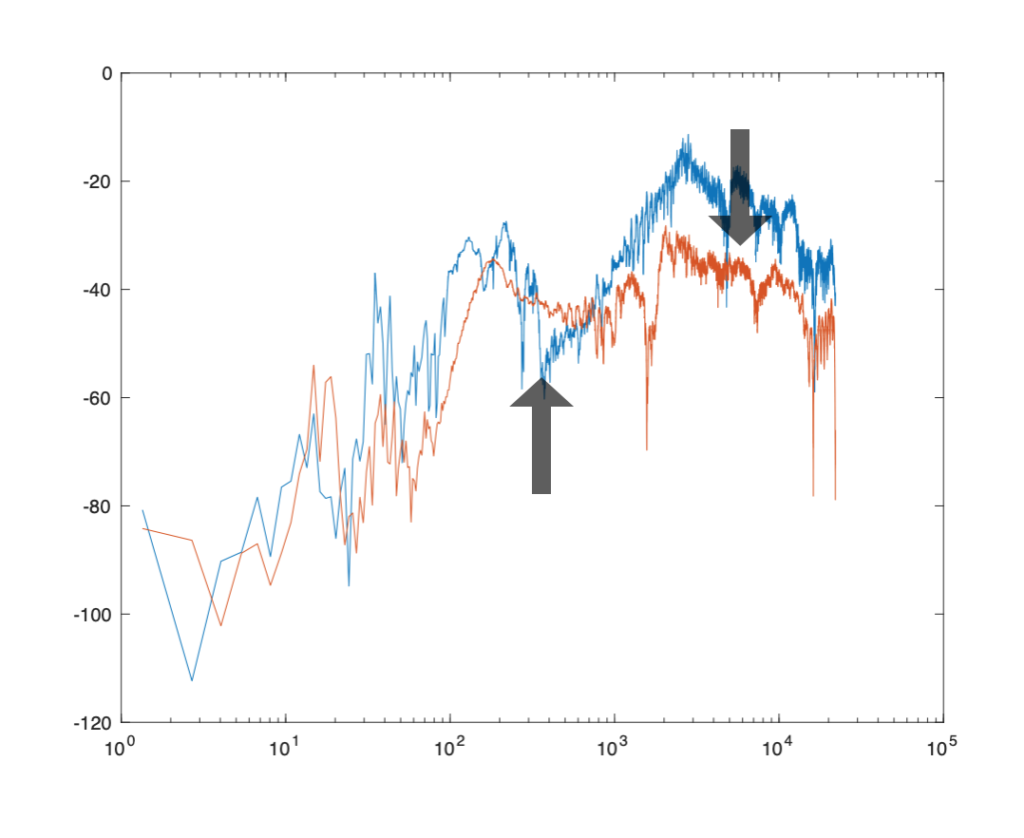
We can see that the high frequencies’ response is lower and low frequencies’ response is higher. Hence, the entire response are flatter than what we have before.
However, there is no response drop without the enclosure, so the enclosure actually leads to the drop.
Two Enclosures Comparison (MLS)
Since the results for MLS and Swept Sine are very similar, we take MLS results as instances in this part.
Lab experiment by Jun in red
Home experiment by Changjie in blue
Without Enclosures:

- Without the enclosure, we can see relatively great difference occurs in low frequency range, which may be the quieter condition in lab allowing better detection of low frequencies. By contrast, room condition is relatively noisy than lab’s, which may introduce interference in low frequency.
- Impulse responses in high frequencies are relatively consistent in the two different environments.
With Enclosures

- With the enclosure, we can see the same phenomenon in low frequencies.
- Focusing on the energy drop around 1600 to 1700 Hz, the same pattern occurs in both curves. The room one has deeper drop.
Since Jun doesn’t include cotton in his enclosure, but Changjie does, the same drop occurred in Jun’s graph indicates that there must be reasons other than cotton leading to the gap.
In another perspective, the deeper gap indicates that cotton is very likely the reason that increase the sound intensity level drop around 1600 to 1700 Hz.
6. Future…
We have several shortcomings in the process of building the enclosure, such as the close distance between driver and port tube, material selection for the sound insulation cotton, etc. Thus, if others want to build loudspeaker enclosures by themselves, our project could provide help and reference.